Regression Discontinuity Design lets you learn causal effects from real policies that switch on at a rule. Think of scholarships that start at a test score, benefits that begin at an income threshold, or audits that trigger above a risk index. The design focuses on cases just on either side of the cutoff. If people cannot precisely game their position, those near the threshold look similar, with the treatment status being the main difference. That local comparison is the engine of RDD.
The goal is to estimate the treatment effect at the cutoff. It is a local answer, not a blanket statement about everyone in the sample. This local focus trades breadth for credibility. You learn what the treatment does for people on the margin of eligibility, which is exactly where many policy decisions are made.
Every RDD has a running variable, a cutoff, and a treatment rule tied to that cutoff. The running variable orders observations, such as an exam score or distance to a boundary. The cutoff splits the sample into eligible and ineligible. Treatment either jumps from zero to one at the cutoff or increases in probability at that point. Outcomes are modeled as smooth functions of the running variable, except for a jump that comes from treatment.
RDD leans on continuity. If nothing special happened at the cutoff other than treatment, the expected outcome as a function of the running variable would be smooth. Any sudden jump at the threshold is then attributed to treatment. The claim lives or dies on that smoothness. If people can sort, if administrators bend rules, or if other programs change at the same point, the jump may not be caused by treatment alone.
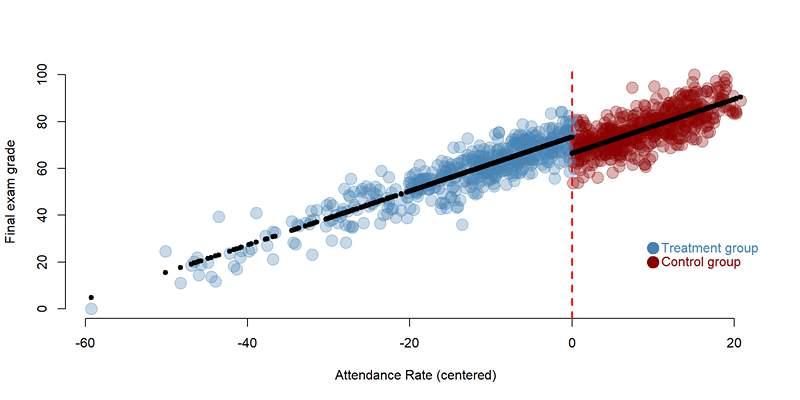
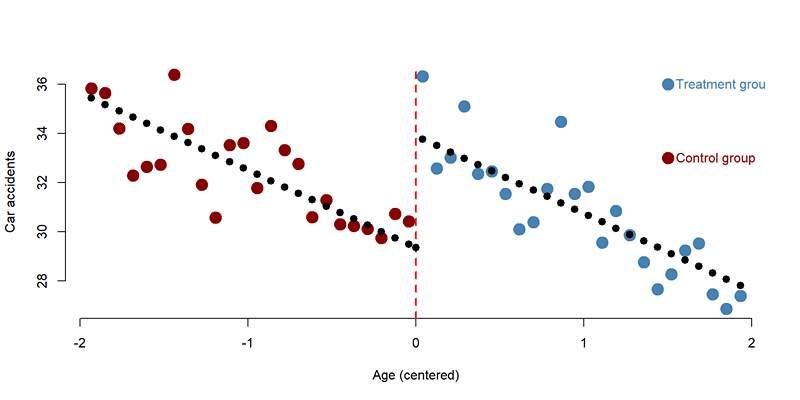
In a sharp design, the rule is strict. Everyone above the cutoff is treated and everyone below is not. Estimation focuses on the size of the outcome jump at the threshold. In a fuzzy design, crossing the cutoff makes treatment more likely but not certain. The jump in treatment probability becomes an instrument for actual receipt, and the ratio of outcome jump to treatment jump gives a local average effect for those whose status changes because of the rule.
You only need data close to the cutoff. A small window reduces bias from slow trends but increases variance. A larger window adds precision but risks bias if the outcome curves bend. Local linear regression on each side of the cutoff is a robust default. High order polynomials tend to chase noise and can mislead. Data driven bandwidth selectors and bias corrected confidence intervals help you balance bias and variance without hand tuning.
Start with a plot. Bin the running variable on each side. Plot average outcomes within bins and overlay separate local fits. A clean jump at the cutoff, with smooth behavior away from the threshold, is a good sign. Repeat with key background variables. These should be flat at the cutoff, since they should not suddenly change when treatment eligibility changes. Visual checks do not replace tests, yet they keep stories honest and easy to explain.
Look for manipulation of the running variable. A density test near the cutoff flags bunching that suggests agents are sorting to the favored side. Check balance in baseline covariates around the threshold. If they jump, something besides treatment is changing. Inspect heaping, such as round numbers that cluster, since that can create artificial spikes. Confirm that no other rule activates at the same point. When interference is possible, for example spillovers to classmates or neighbors, be explicit about how that affects interpretation.
Some applications benefit from a donut hole, which drops observations in a tiny band around the cutoff if gaming is suspected right at the threshold. Multi score settings call for a clear choice of the true running variable. Multiple cutoffs can be combined with fixed effects that align local comparisons within each threshold. Geographic RDDs treat borders as cutoffs, but they need careful controls for spatial trends and neighborhood sorting.
Use standard errors that are robust to heteroskedasticity and clustered structures if the running variable repeats within groups. Bias corrected intervals account for the fact that local fits carry bias near edges. Always report the bandwidth used, the kernel, the order of the local polynomial, and whether the estimate is sharp or fuzzy. Small choices change answers at the third decimal place, and being explicit helps others reproduce your work.
An RDD answer is local to the cutoff. It tells you the effect for people who were nearly eligible or barely eligible, not for those far away in score or income. This limits sweeping claims, yet it aligns with decisions about marginal expansions or tighter rules. If leaders plan to move the cutoff, the local effect is exactly the number they need. When a broader effect is required, consider designs that cover more of the score range, but do not stretch RDD beyond what it can support.
RDD fits best when a credible rule ties treatment to a measured score, when people cannot precisely sort across the threshold, and when no other shocks occur at the same point. It is a strong choice when randomized trials are not possible but administrative thresholds exist.
It is a poor fit when rules are loose, when treatment depends on judgment that also affects outcomes, or when the score itself is affected by prior exposure to treatment. In those cases, the jump at the cutoff mixes many forces and loses its clean interpretation.
Define the running variable and the exact cutoff in plain terms. Clean the score, document how ties or missing values are handled, and keep a record of any recoding. Choose a local window using a data driven selector, then commit to that window for the main result. Fit separate local lines on each side, report the jump, and include bias corrected intervals.
Plot outcomes and covariates around the threshold. Run density and balance checks. If results hinge on a narrow set of choices, say so, and show how the estimate moves under modest changes in bandwidth or fit. That transparency will save time during review.
Regression Discontinuity Design shines when treatment follows a rule and gaming is limited. By focusing on observations near a threshold, modeling smooth trends on either side, and reading any jump as a treatment effect, you gain a credible local answer that leaders can use.
The craft is in the details, pick a sensible window, favor simple local fits, check for sorting, keep plots and tests aligned, and be exact about what the estimate means. Used with care, RDD turns everyday policies into natural experiments that speak clearly about cause and effect right where decisions are made.

Failures often occur without visible warning. Confidence can mask instability.

We’ve learned that speed is not judgment. Explore the technical and philosophical reasons why human discernment remains the irreplaceable final layer in any critical decision-making pipeline.

Understand AI vs Human Intelligence with clear examples, strengths, and how human reasoning still plays a central role

Writing proficiency is accelerated by personalized, instant feedback. This article details how advanced computational systems act as a tireless writing mentor.

Mastercard fights back fraud with artificial intelligence, using real-time AI fraud detection to secure global transactions

AI code hallucinations can lead to hidden security risks in development workflows and software deployments

Small language models are gaining ground as researchers prioritize performance, speed, and efficient AI models

How generative AI is transforming the music industry, offering groundbreaking tools and opportunities for artists, producers, and fans alike.

Exploring the rise of advanced robotics and intelligent automation, showcasing how dexterous machines are transforming industries and shaping the future.

What a smart home is, how it works, and how home automation simplifies daily living with connected technology

Bridge the gap between engineers and analysts using shared language, strong data contracts, and simple weekly routines.

Optimize your organization's success by effectively implementing AI with proper planning, data accuracy, and clear objectives.